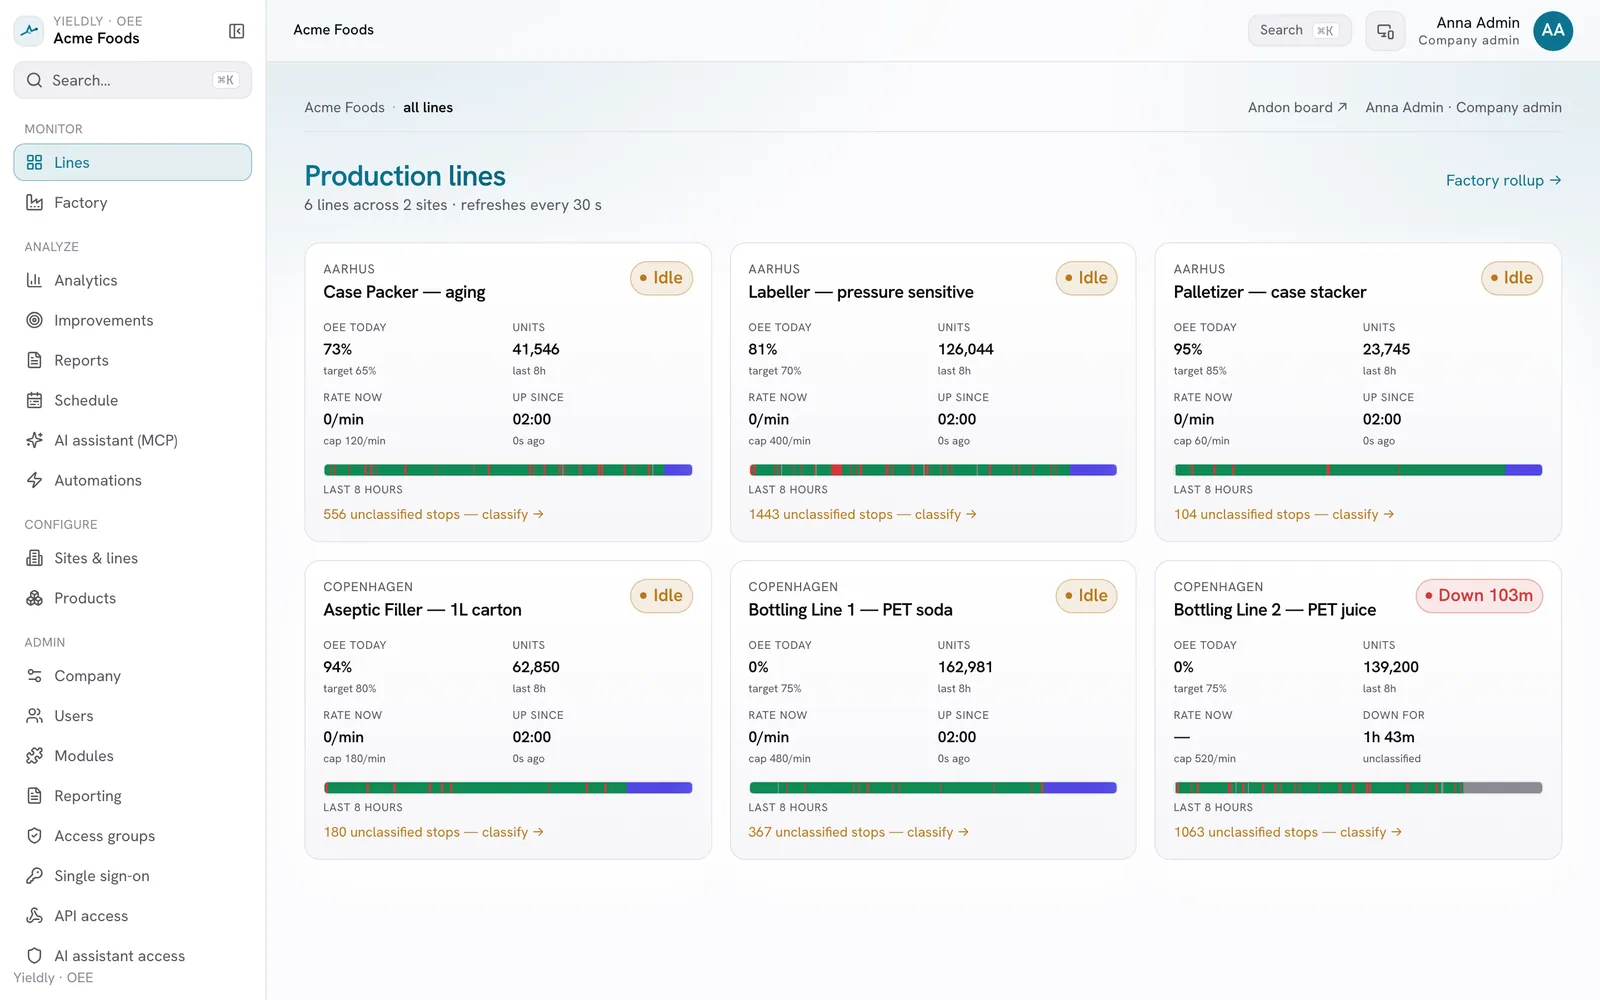
One platform, from the live tile to the boardroom
Real-time OEE, stop capture at the source, loss analysis and automatic reporting, so the operator, the supervisor and the plant manager all work from the same truth.
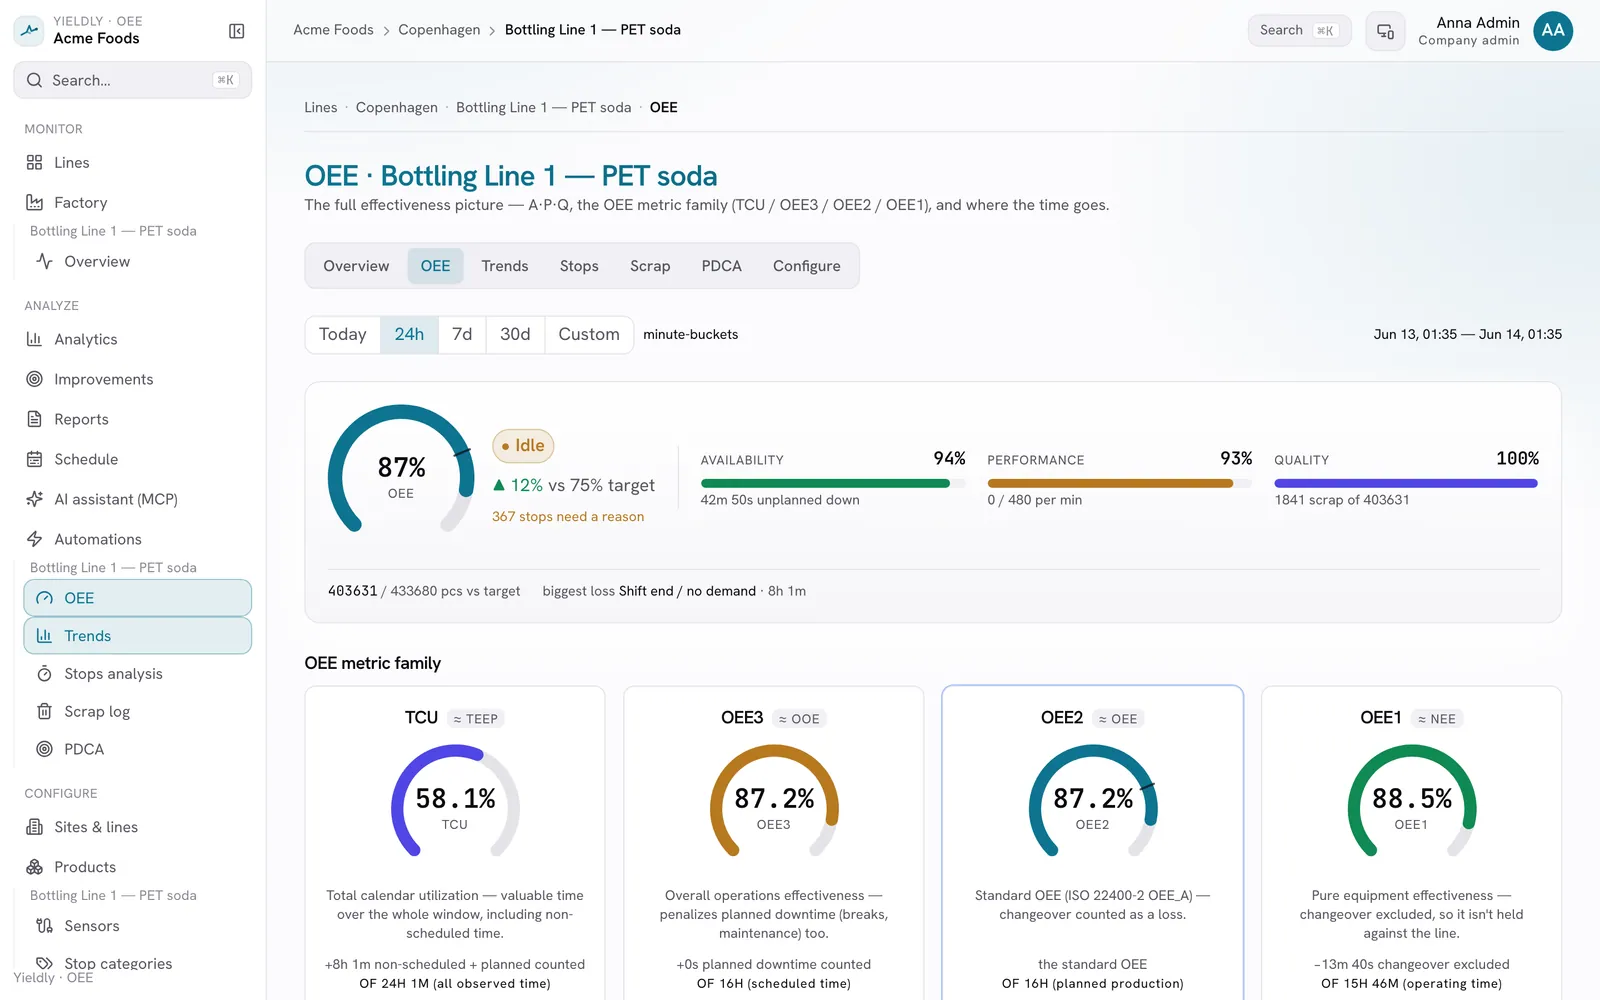
What is OEE?
Overall Equipment Effectiveness is the single measure of how well a machine turns scheduled time into good product. It multiplies three factors, and because any one of them can quietly cost you, you want all three visible at once.
We calculate OEE to the normative ISO 22400-2 definition, so the number is consistent and comparable across every line and site you run.
Availability
Was it running when it was scheduled to? Lost to breakdowns, changeovers and unplanned stops.
Performance
Was it running at the speed it should? Lost to slow cycles, minor stops and idling.
Quality
Was the output good the first time? Lost to scrap, rework and startup rejects.
OEE = Availability × Performance × Quality.
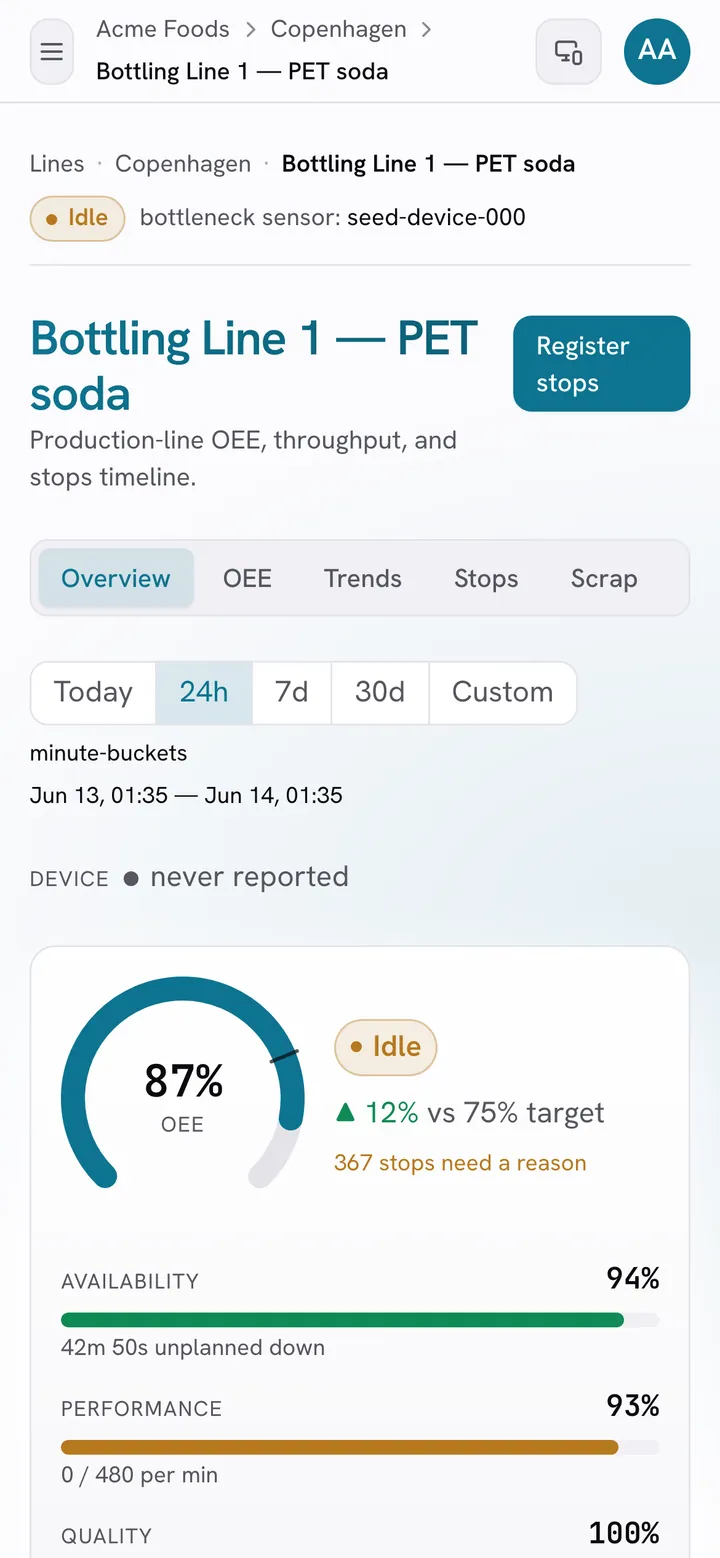
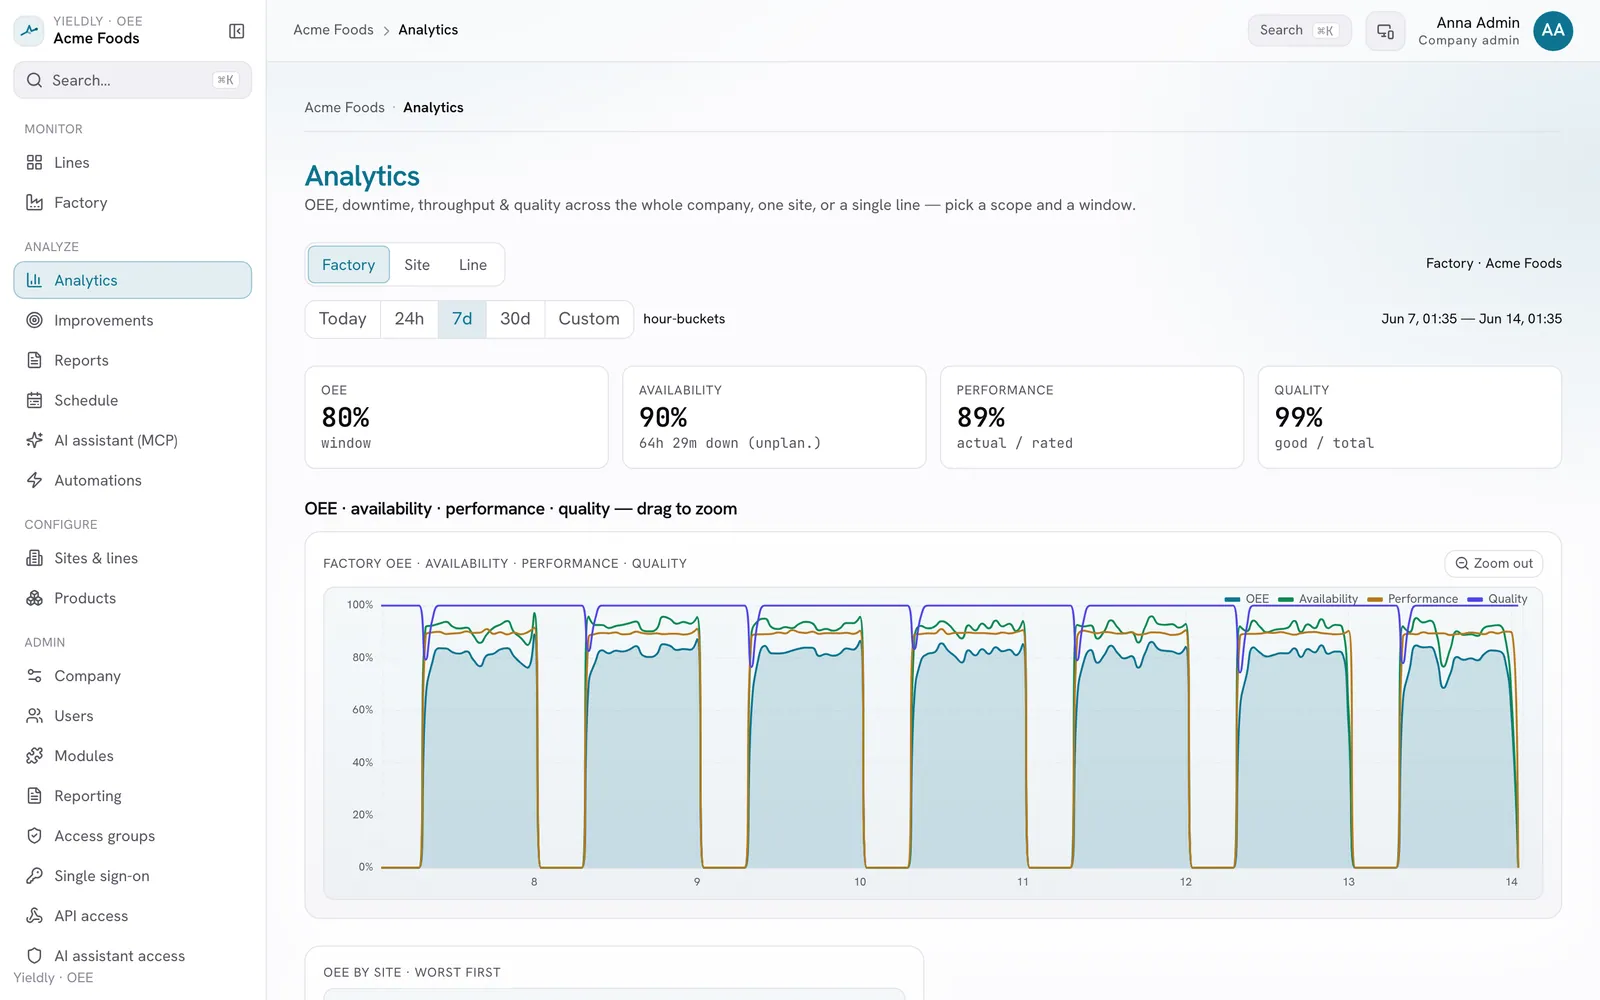
The full effectiveness picture, in real time
From total plant utilisation down to pure equipment effectiveness: the whole metric family, updating continuously, with availability, performance and quality always broken out.
- A trustworthy OEE number, standards-based
- Time-of-day trends and target comparison
- Drill into any window: today, this shift, last 30 days
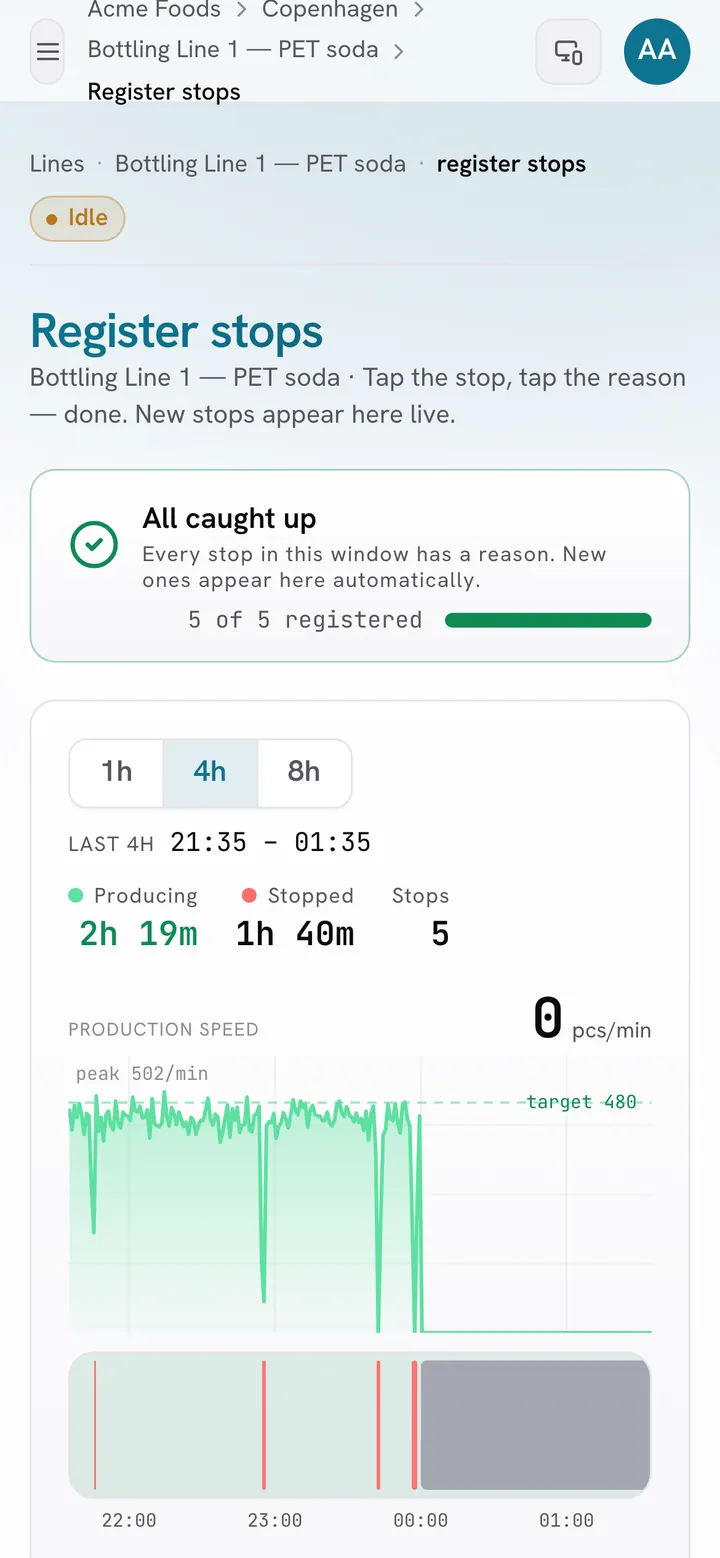
Every stop carries a reason
Stops are detected automatically and classified in one tap on a phone or floor tablet, so downtime is never invisible and never reconstructed from memory at the end of a shift.
- Automatic detection, so nothing slips through
- One-tap classification, built for gloves and grime
- A live line board everyone can read across the floor
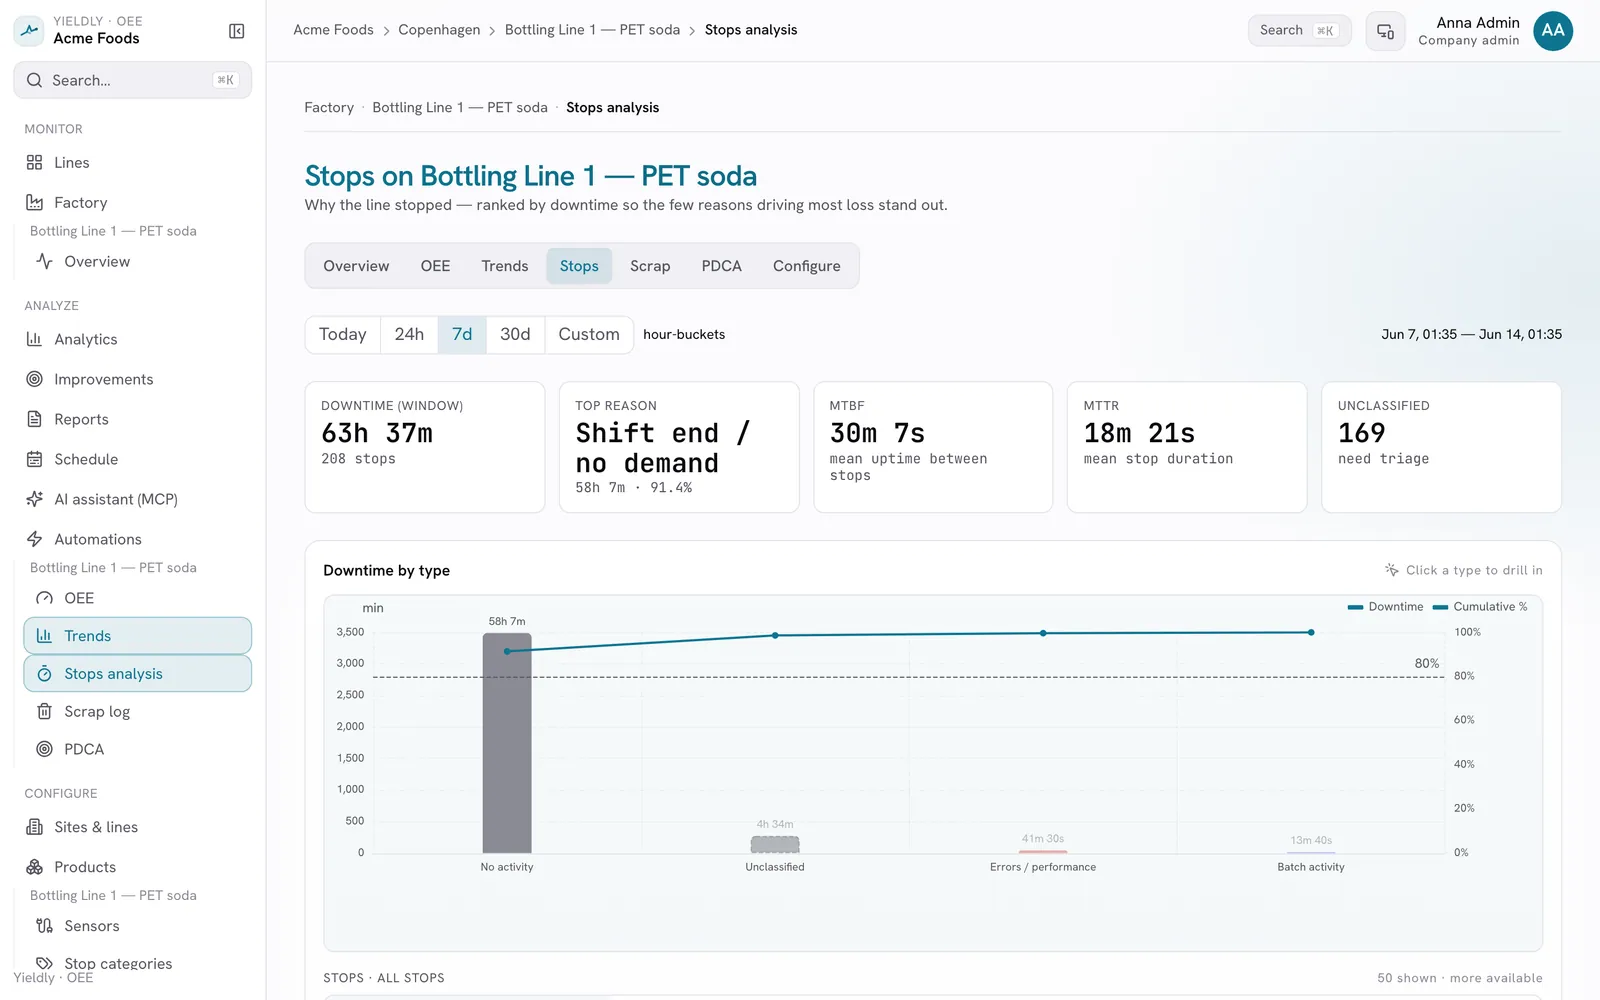
Know what to fix next
Downtime ranked by impact reveals the vital few reasons behind most of your losses. Pair it with mean time between stops and mean stop duration to target the work that pays back.
- Pareto ranking of every loss
- MTBF and MTTR at a glance
- Plant → line → machine drill-down
See the pattern, not just the moment
Compare lines, shifts and products over time to spot drift before it costs you, and to confirm an improvement actually moved the number.
- Cross-line and cross-shift comparison
- Throughput and speed over any window
- The evidence behind every decision
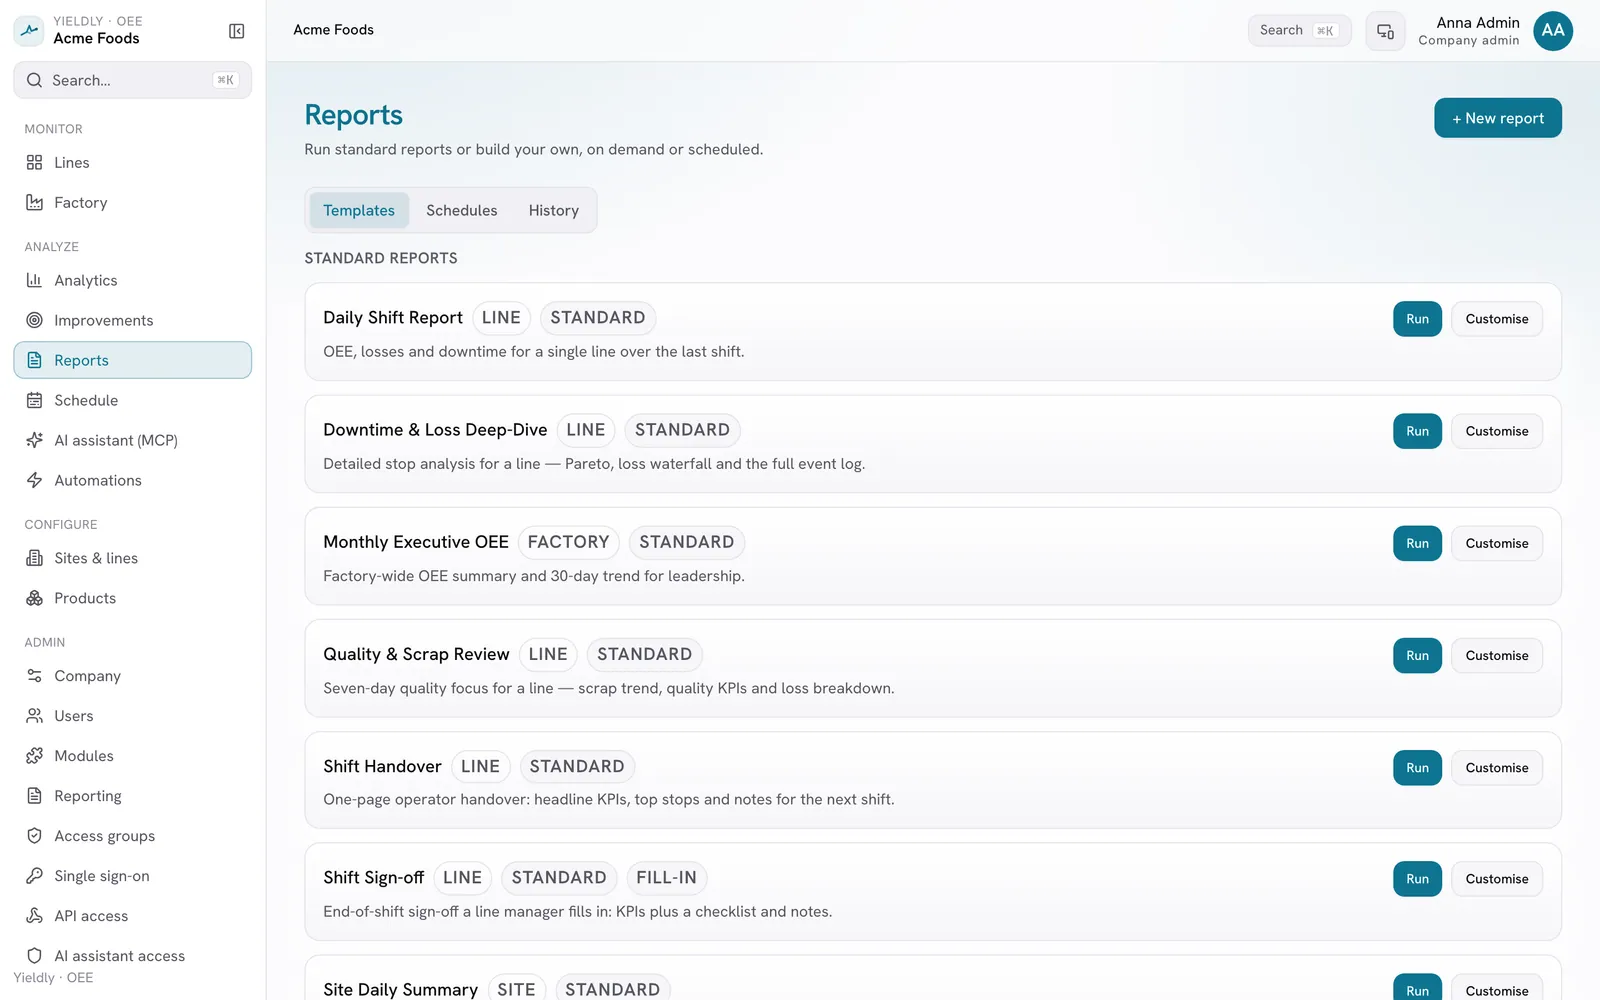
The report is already done
Standard and custom OEE report templates, generated automatically and delivered on schedule. No more rebuilding the same spreadsheet every Monday.
- Scheduled and on-demand reports
- Templates you can tailor to your format
- One set of numbers, formatted per audience
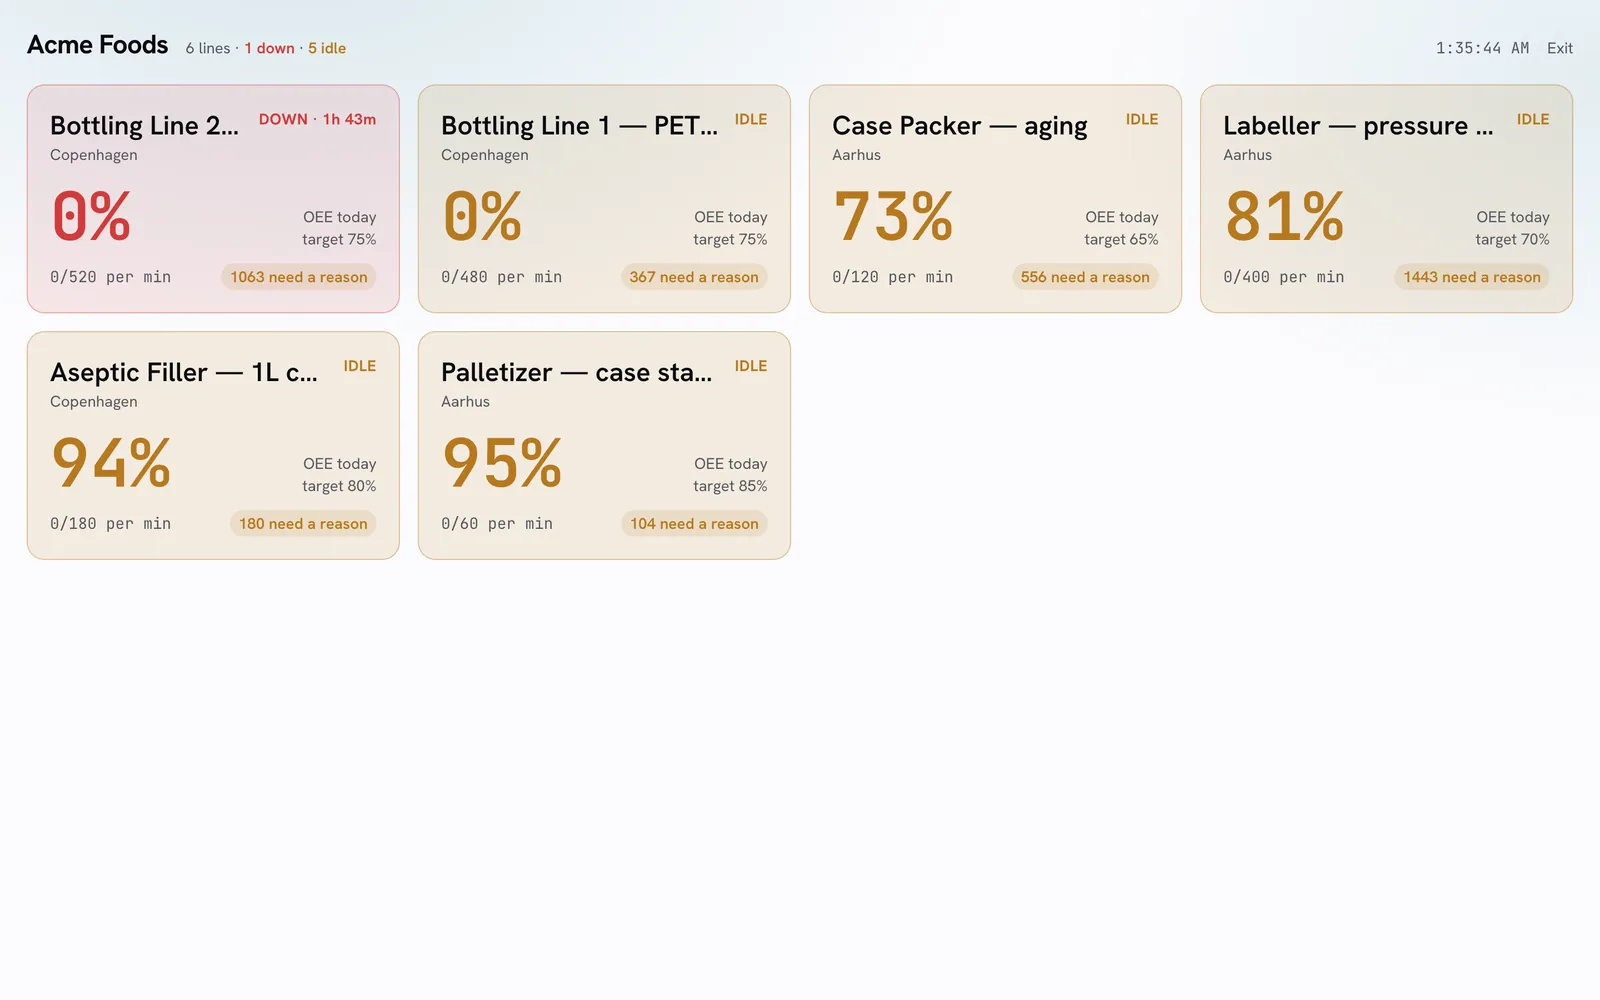
The whole plant, at a glance
Roll performance up across cells, lines and sites, and put a live Andon board on the wall so the floor sees status the instant it changes.
- Site and factory rollups
- Big-screen Andon for the shop floor
- Continuous improvement cycles tied to the live data
The same truth, in everyone's hands
Operators
Log why the line stopped in one tap, and see live line status without leaving the machine.
Supervisors
Watch OEE and stops as they happen, and act on the biggest losses this shift.
Plant managers
Roll up performance across lines and sites, with reports that arrive on their own.
CI & engineering
Run structured improvement against the real numbers and prove the gain.
Ask your factory, in plain language
Connect Claude or ChatGPT straight to your live production data. Ask about OEE, recent stops or trends in plain English and get answers from your real numbers - no dashboards to dig through, no SQL.
- Works with the AI assistants your team already uses.
- Answers respect each person's access - it only ever sees the lines they're allowed to.
- Built on the open Model Context Protocol, not a locked-in bot.
Advanced modules for scaling teams
Add what your organisation needs - secure sign-on, automated user provisioning, structured improvement, and programmatic access - all governed by the same strict, role-based controls.
Single sign-on
Let your team sign in with your company identity provider (SAML or OIDC).
AI assistant connector (MCP)
Let AI assistants securely query your production data through the Model Context Protocol.
Continuous improvement (PDCA)
Run Plan-Do-Check-Act improvement cycles anchored to your OEE loss data.
API access
Integrate with your systems using API tokens and machine-to-machine clients.
Directory sync (SCIM)
Provision and deactivate users + groups automatically from your identity provider.
Multi-factor authentication
Add a second factor at sign-in and require it across your company for an extra layer of account security.
See your real OEE - on your lines.
Book a 30-minute demo and we'll show you live OEE, stop capture and reporting on a line like yours.