Turn downtime into output.
See true OEE on every line as it happens, capture each stop the moment it occurs, and turn your biggest losses into action on the floor and in the boardroom.
Live in a day · No control-system integration · Built on ISO 22400-2
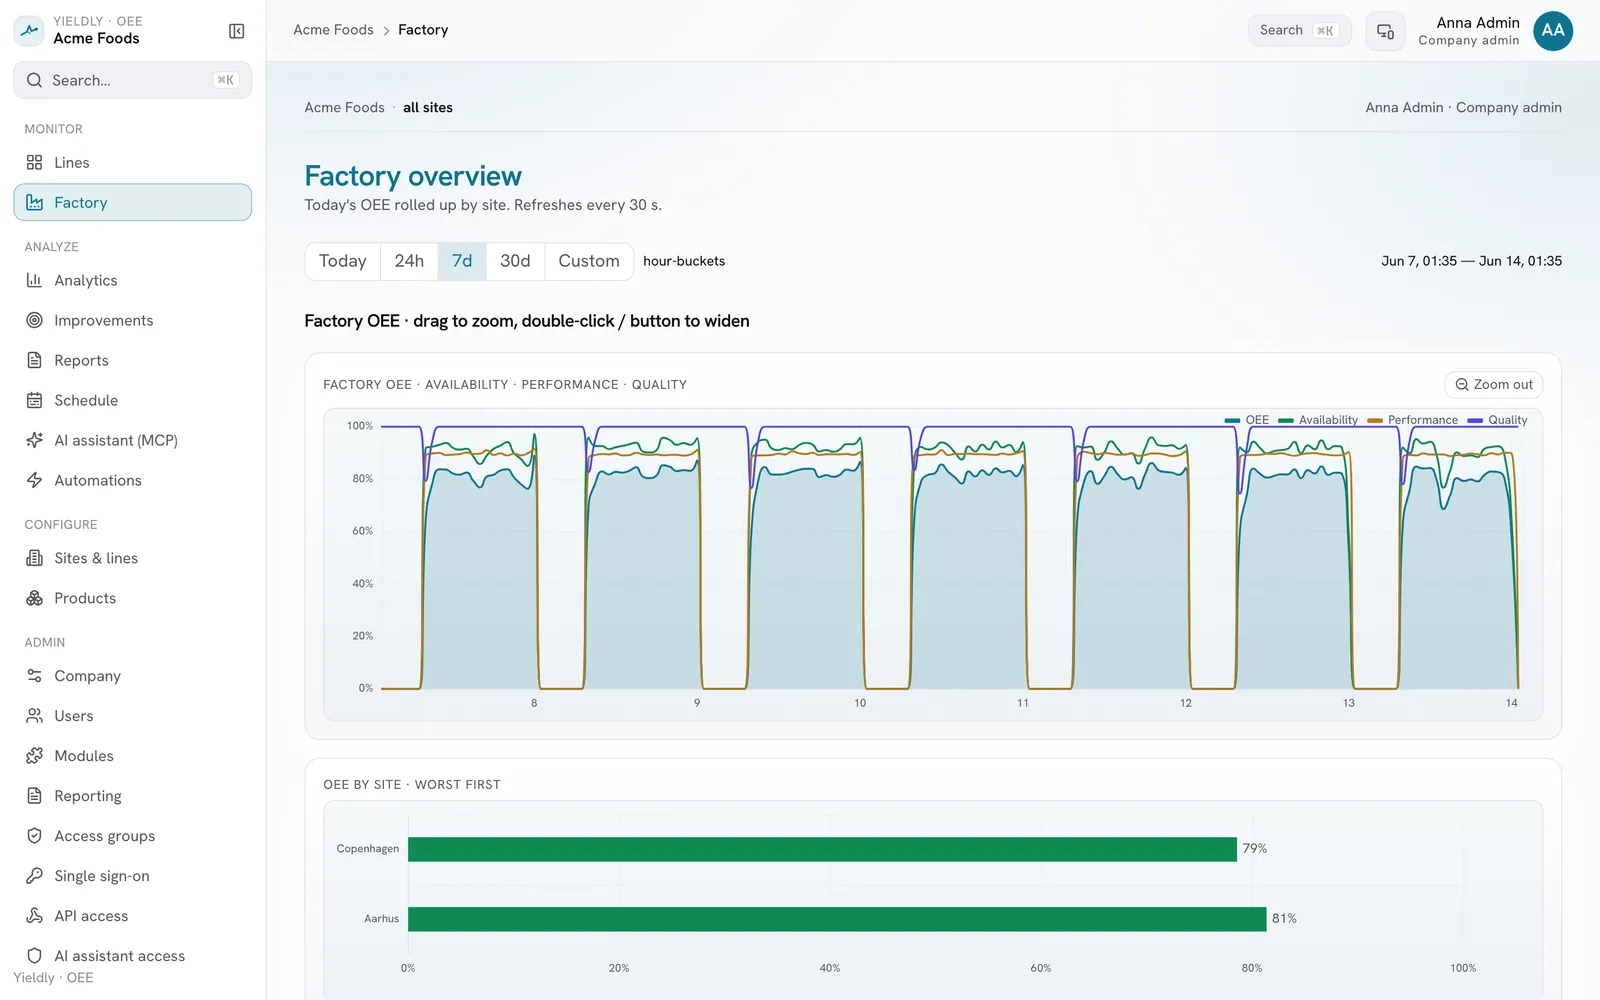
Your whole line, as it actually runs
A real bottling line: filler, capper, labeller, then two packers. Watch the bottleneck pace the line, and see exactly what a single stop does to everything around it.
Steady flow - every machine measured
Each station streams live counts from its plug-in sensor. The Capper is the bottleneck - station 2 sets the line's pace.
Throughput
11,800bph
Line OEE
82%
Detect
Stop caught automatically
Classify
Operator logs the cause
Analyze
Ranked in loss analysis
Improve
Fix the recurring cause
How much does a minute of downtime cost you?
Whatever the number, multiply it by every unlogged stop, on every line, every shift. That's the hole you can't see today. One avoidable stop a month can cost more than a year of monitoring, so the maths is simple: Yieldly pays for itself the first time it saves you a stop.
Install without stopping
Clip the sensor on while the line runs. There's no production stop to fit it, so measuring starts the same shift.
No change request
It never touches the machine or its controls, so there's no IT ticket, no validation, no engineering sign-off.
Totally external
Wi-Fi or cellular, off your machine network. Nothing to certify, and nothing that can ever interfere with the line.
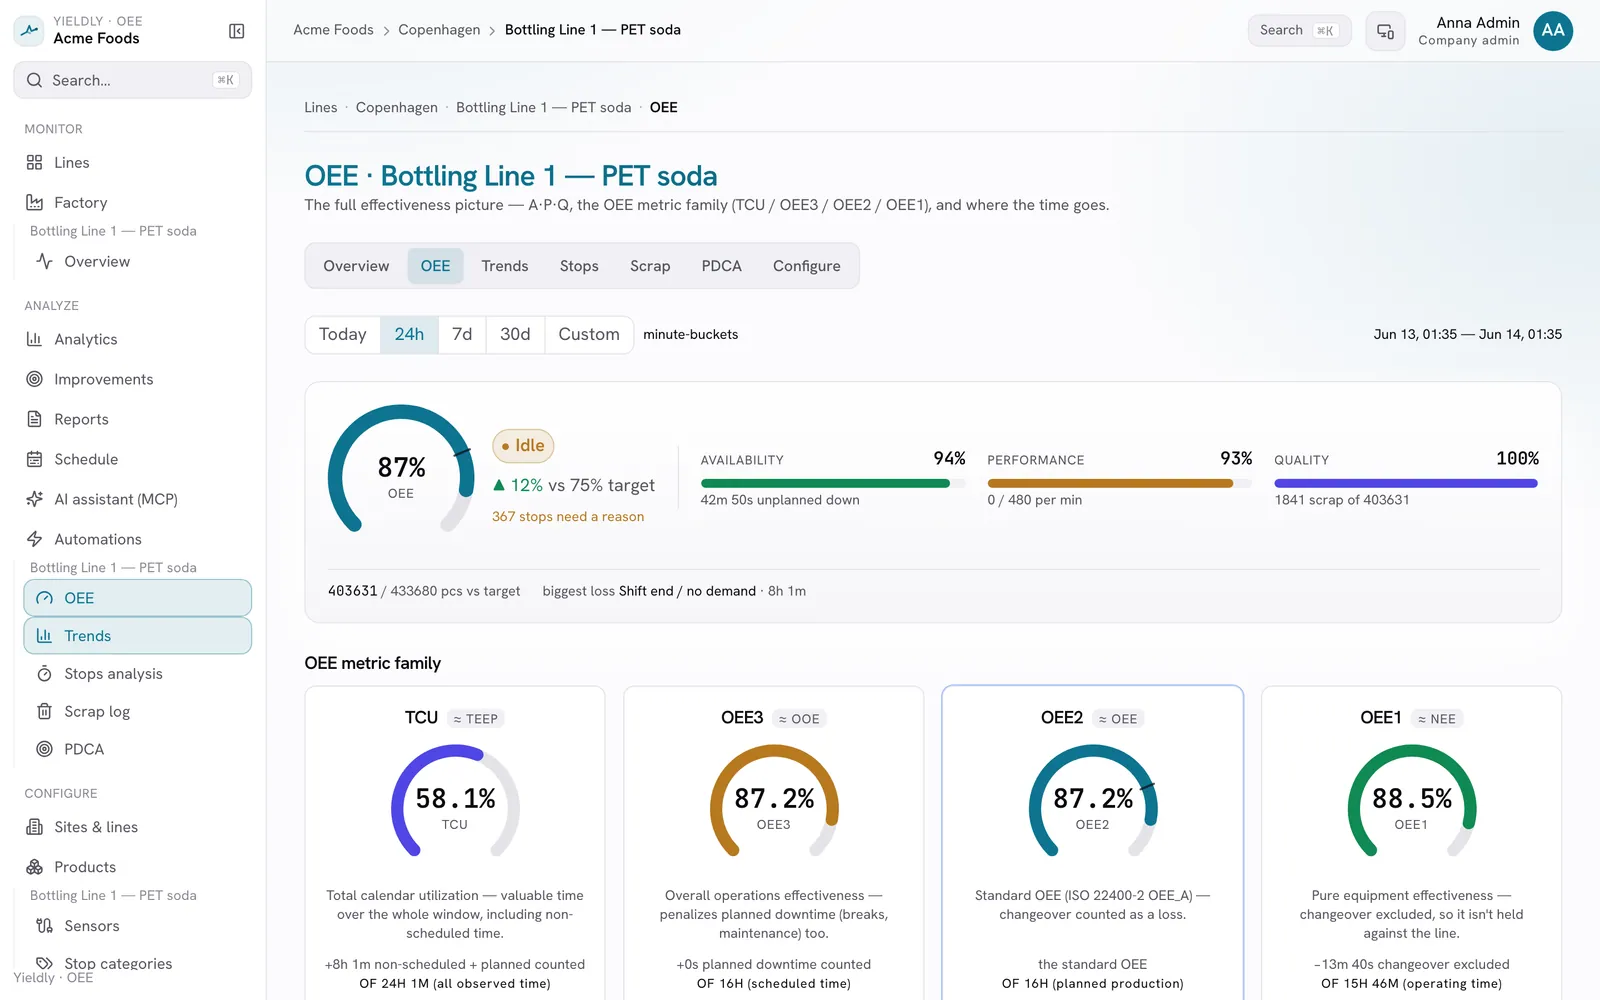
Every loss, from calendar to good output
OEE collapses a whole waterfall of losses into one number. See exactly where the hours go, and why the same output reads as four different scores depending on the time base. We calculate all of it to the ISO 22400-2 standard.
One output, four lenses
of full calendar time · TEEP
of scheduled time · OOE
standard OEE · ISO 22400-2
changeover excluded · pure availability
Illustrative example. The same fully-productive output is 70% as standard OEE - but only 48% of the calendar. The gap is capacity you already own.
You can't improve what you can't see
Most lines lose hours every week to stops no one logged and speed no one noticed. We make those losses visible, and then fixable.
Measure
A true, standards-based OEE number for every machine - automatically, in real time.
Capture
Every stop detected and reasoned at the source, so losses are never invisible again.
Improve
Rank the losses that matter, act with your team, and prove the gain against the live data.
Everything you need to run a tighter line
One platform for the operator, the supervisor and the plant manager, from the live tile on the floor to the rolled-up report.
True OEE, live
One honest number per line - availability × performance × quality - updating in real time, calculated to the ISO 22400-2 standard so it holds up in any review.
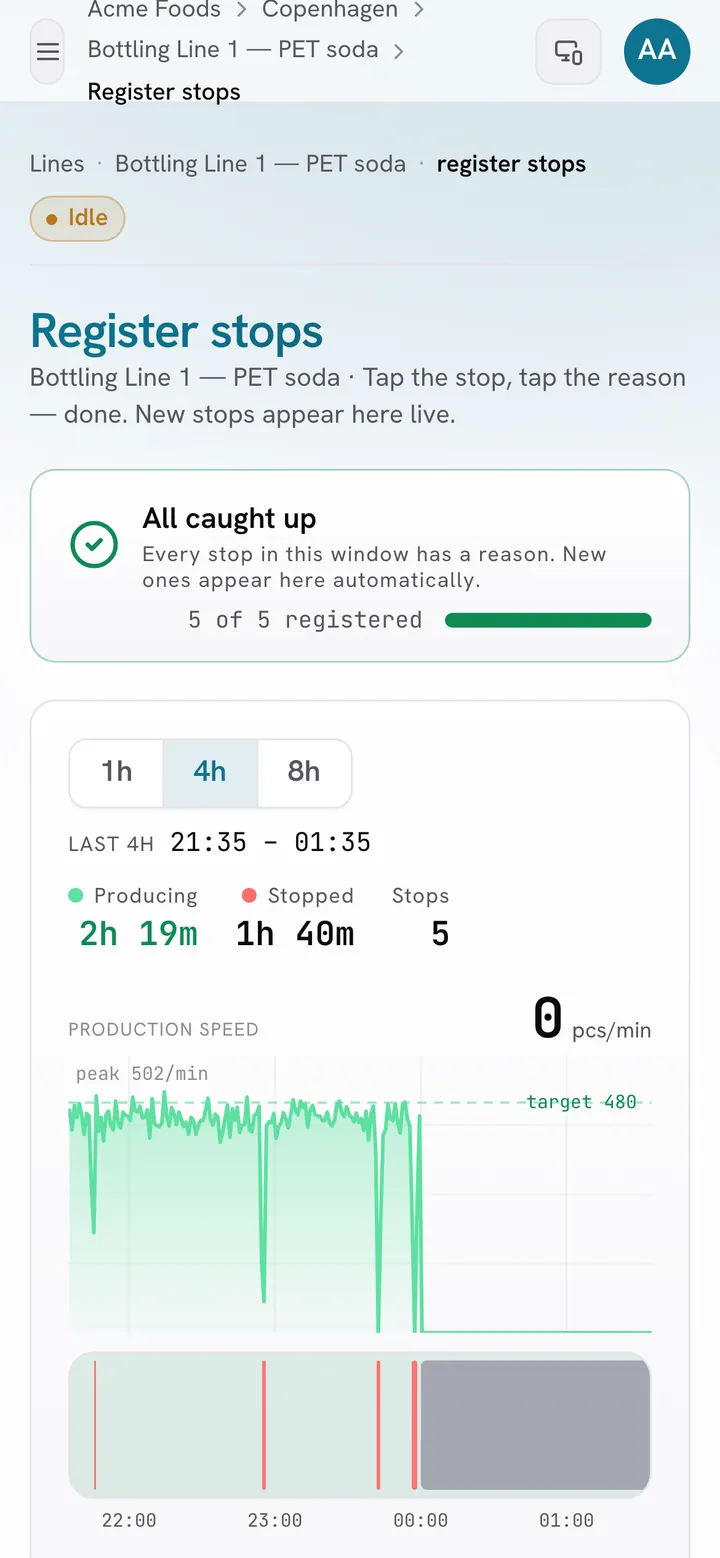
Every stop, captured
The line stopping is detected automatically the moment it happens - no clipboards, no end-of-shift guesswork. Nothing slips through.
One tap to log a reason
Operators classify a stop from a phone or a floor tablet with a single tap. Reasons land in the data instantly, where everyone can see them.
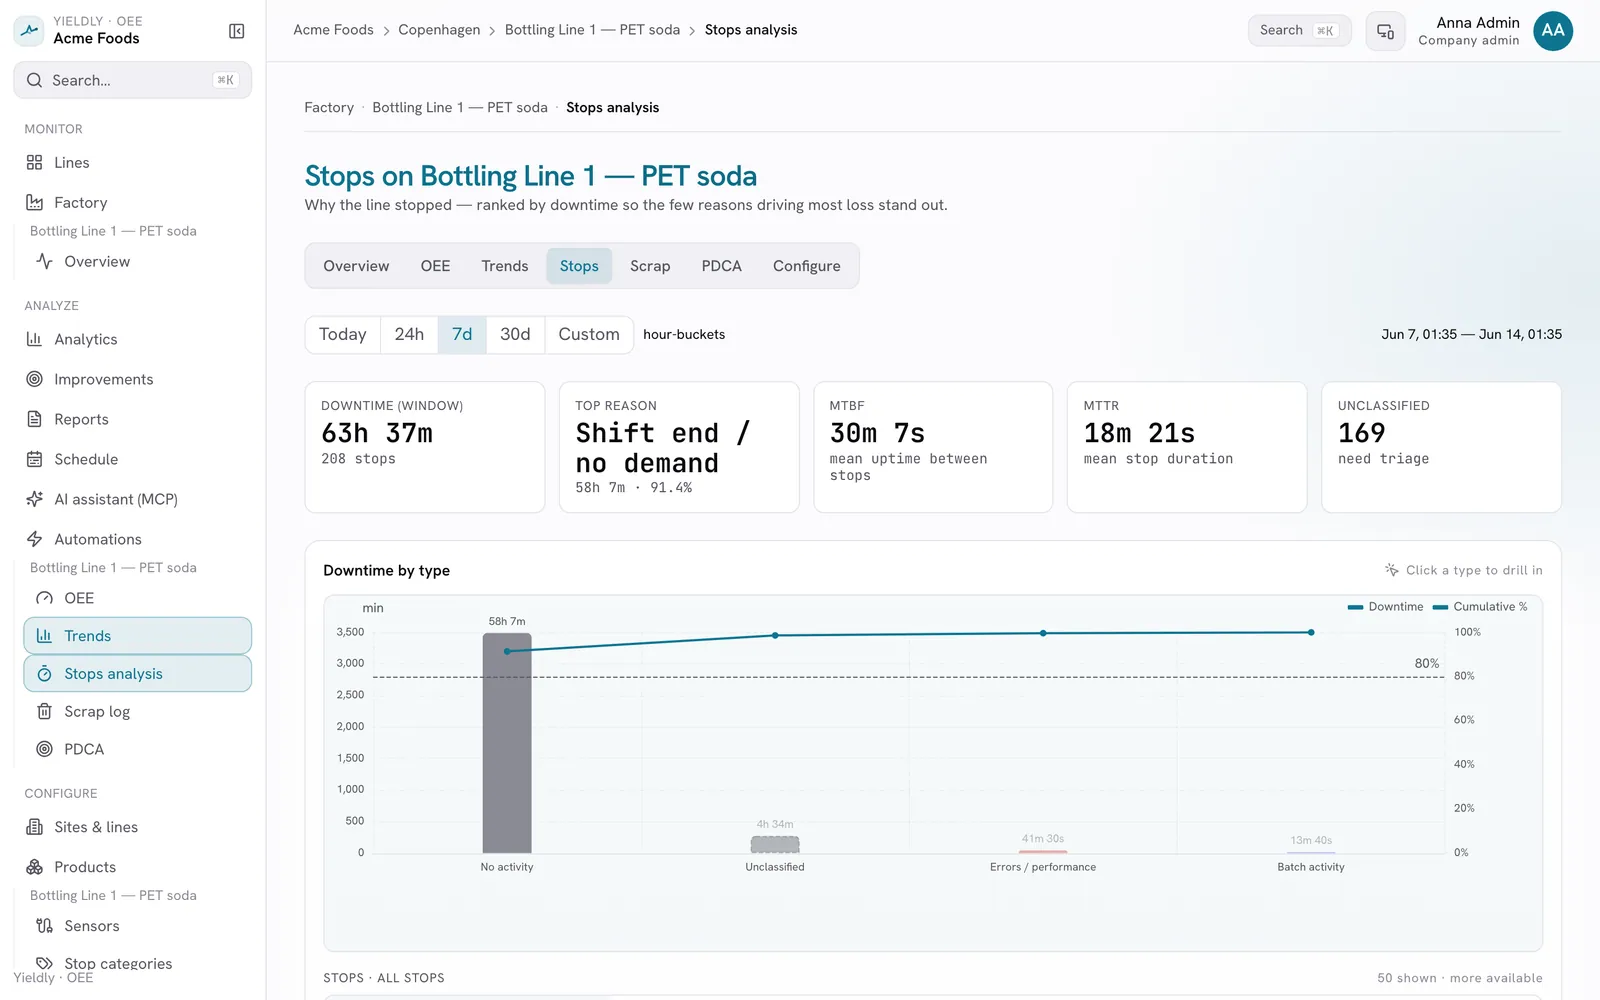
Find the costly losses
Downtime ranked by impact, so the few reasons driving most of your losses stand out. You always know what to fix next.
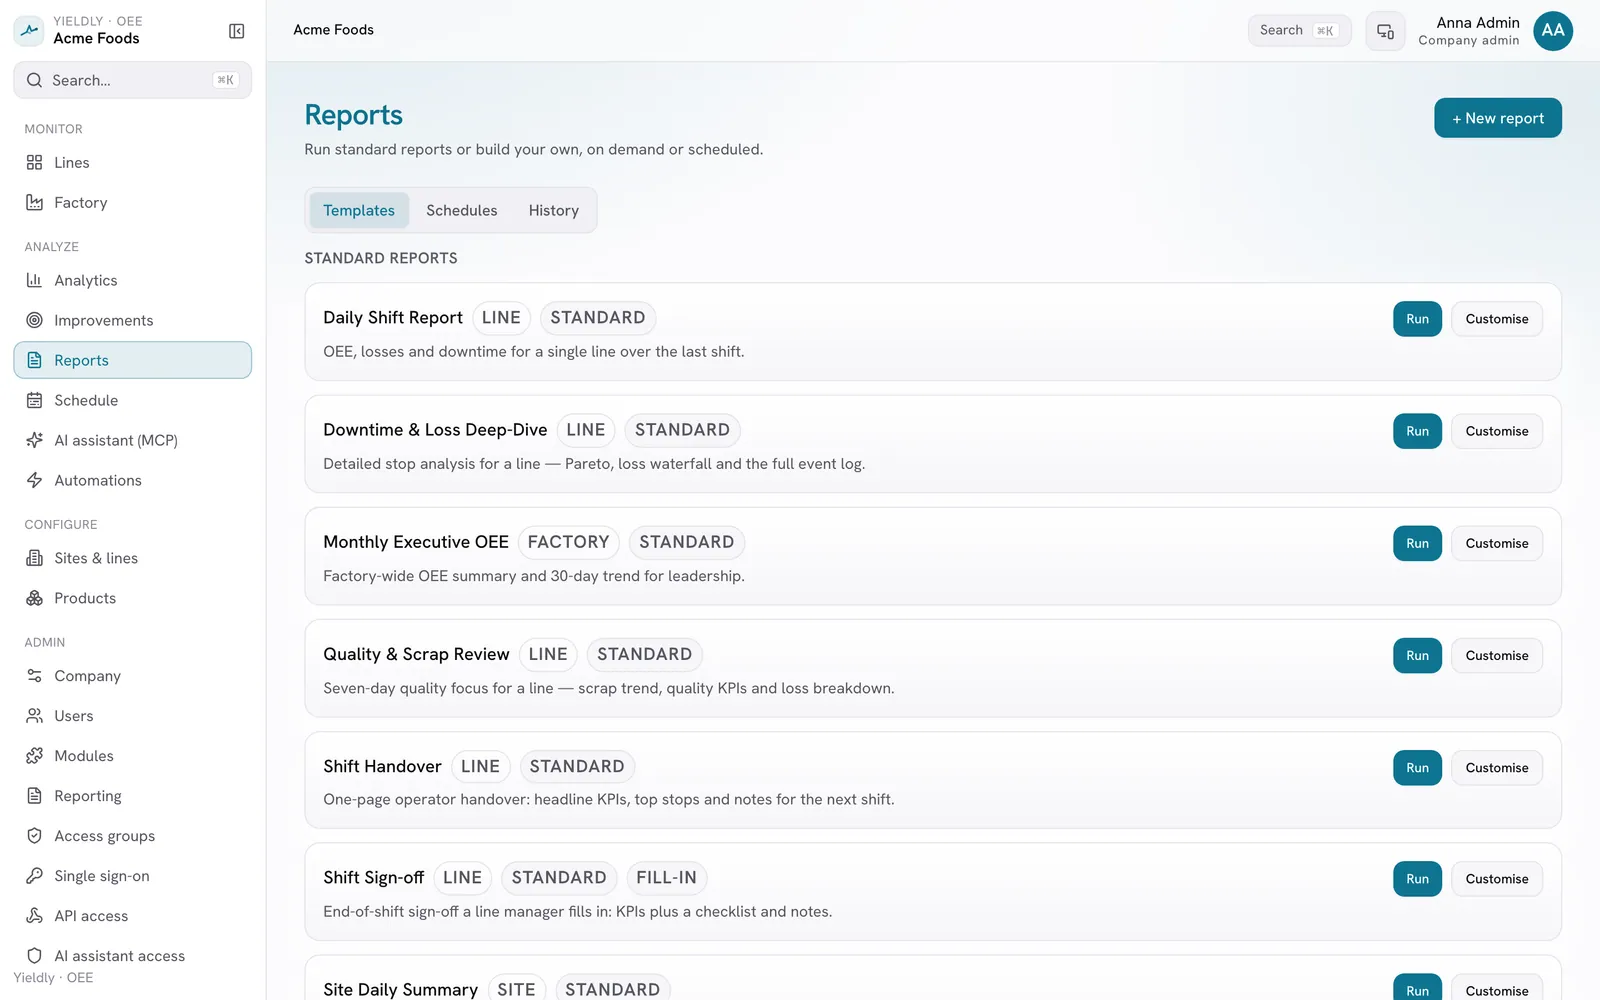
Reports that write themselves
Shift, daily and weekly OEE reports generated automatically and delivered on schedule. Reclaim the hours that went into spreadsheets.
From one line to the whole plant
Roll performance up across cells, lines and sites - or drill into a single machine. The same picture for the operator and the plant manager.
Improvement you can prove
Run structured improvement cycles against the live numbers, so a change on the floor shows up as measurable gain - not a hunch.
Live in a day
Plug-in sensors fit on any machine - old or new, no PLC integration project. Power on, claim it in the app, and data flows.
Plan vs actual, side by side
Build a finite-capacity production schedule and watch the line run against it - adherence and attainment sitting right next to live OEE.
Quality losses, captured
Log scrap and rework with a reason in seconds. The quality leg of OEE comes from real entries, not an end-of-shift guess.
The real number, the moment it changes
Availability, performance and quality for every line, calculated continuously to the ISO 22400-2 standard, with the full metric family from plant utilisation down to pure equipment effectiveness.
- A single, honest OEE figure you can trust in any review
- See exactly where time is going - down, slow, or scrap
- Compare today against target, this shift against last
One tap on the floor, never a clipboard again
The line stopping is detected automatically. Operators classify the reason from a phone or a wall tablet in a single tap, so every minute of downtime carries a why while it's still fresh.
- Automatic stop detection - nothing missed at shift change
- Big, touch-friendly reasons; classify in one tap
- A live status board the whole line can see
Fix the few losses that cost the most
Downtime ranked by impact, so the handful of reasons behind most of your losses jump out. Drill from the plant view into a single machine and know exactly what to tackle next.
- Pareto view - the vital few, not the trivial many
- Mean time between stops and mean stop duration at a glance
- Drill from site → line → machine without losing the thread
Reports that write themselves
Shift, daily and weekly OEE reports generated automatically and delivered on schedule: to the inbox, on the wall, wherever your team looks. Reclaim the hours that used to go into spreadsheets.
- Standard templates, or build your own to match how you report
- Scheduled and on-demand - no more Monday-morning Excel
- The same numbers everyone trusts, formatted for the audience
Ask your factory, in plain language
Connect Claude or ChatGPT straight to your live production data. Ask about OEE, recent stops or trends in plain English and get answers from your real numbers - no dashboards to dig through, no SQL.
- Works with the AI assistants your team already uses.
- Answers respect each person's access - it only ever sees the lines they're allowed to.
- Built on the open Model Context Protocol, not a locked-in bot.
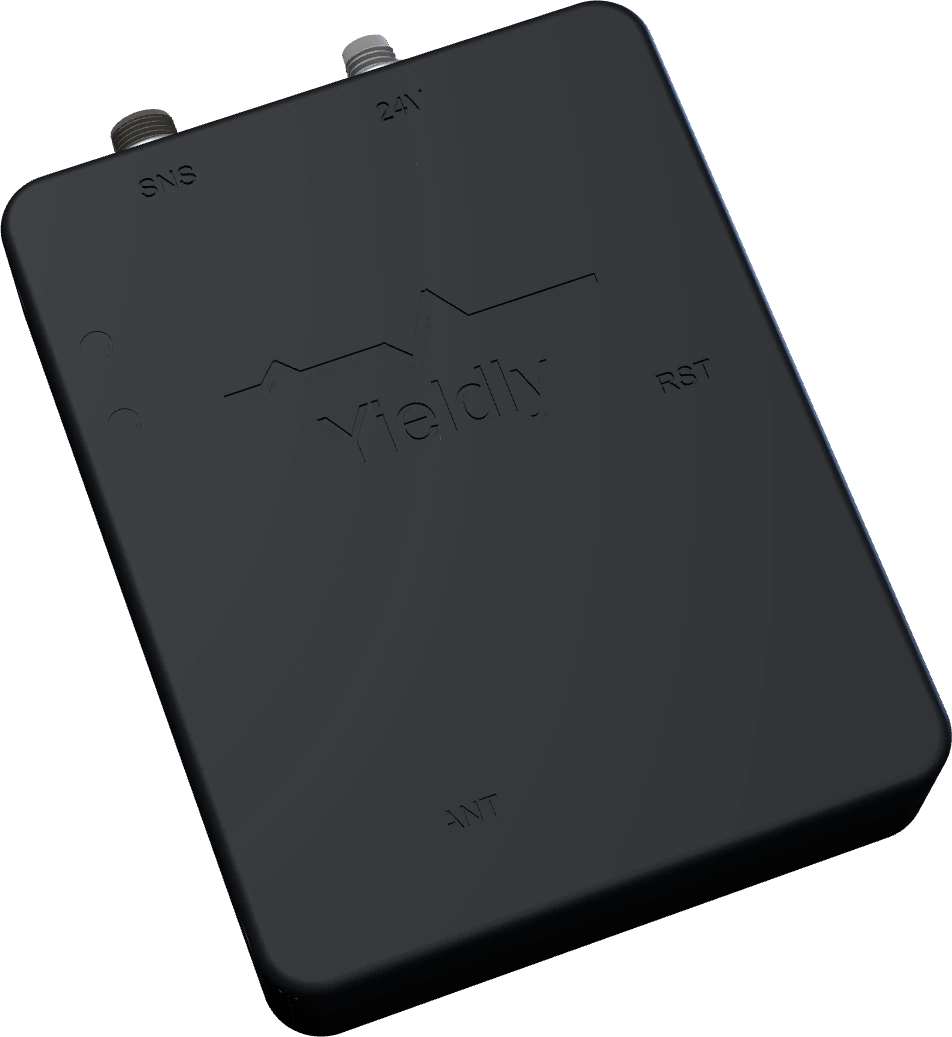
A plug-in sensor for any machine
No PLC project, no IT ticket. Mount the sensor, power it on, and claim it in the app with the code on the label. It counts output directly - so you get accurate data on equipment of any age, live the same day.
From box to insight in three steps
No integration project. Most lines are live the same day they unbox a sensor.
Mount the sensor
Attach a plug-in counter to the machine and power it on. Works on any line, no wiring into the control system.
Claim it in the app
Type the code on the label to bind the sensor to its line. Counts start flowing within minutes - nothing to configure.
See - and act
Watch live OEE, get stops the instant they happen, and turn the biggest losses into action with your team.
Fits the systems you already run
Zapier, Make, n8n and webhooks out of the box, plus an open API to push OEE, stops and counts into your MES, ERP or data warehouse. And you stay in control: events only ever leave for the destinations and lines you allow.
Advanced modules for scaling teams
Add what your organisation needs - secure sign-on, automated user provisioning, structured improvement, and programmatic access - all governed by the same strict, role-based controls.
Single sign-on
Let your team sign in with your company identity provider (SAML or OIDC).
AI assistant connector (MCP)
Let AI assistants securely query your production data through the Model Context Protocol.
Continuous improvement (PDCA)
Run Plan-Do-Check-Act improvement cycles anchored to your OEE loss data.
API access
Integrate with your systems using API tokens and machine-to-machine clients.
Directory sync (SCIM)
Provision and deactivate users + groups automatically from your identity provider.
Multi-factor authentication
Add a second factor at sign-in and require it across your company for an extra layer of account security.
Numbers that hold up
OEE is calculated to the normative ISO 22400-2 definition, and your equipment is modelled on the ISA-95 hierarchy: enterprise, site, area, line, cell, machine. So the metrics are comparable across lines and sites, and they integrate cleanly with the rest of your stack.
Questions, answered
What is OEE?
Overall Equipment Effectiveness is the single measure of how well a machine turns scheduled time into good product. It combines three factors - availability (was it running?), performance (was it running at speed?) and quality (was the output good?). We calculate it to the ISO 22400-2 standard, so the number is comparable across lines and sites.
Do I need to integrate with my machines' control systems?
No. Our plug-in sensors mount on the machine and count output directly, so you get accurate data on old and new equipment alike - without a PLC or SCADA integration project. If you later want to connect MES/ERP systems, an open API and webhooks are there when you need them.
How long until we see data?
Most lines are live the same day. Mount the sensor, claim it in the app with the code on its label, and counts start flowing within minutes.
Who is it for?
Everyone who touches the line. Operators get a fast way to log why it stopped; supervisors get live status and loss analysis; plant and operations managers get rolled-up performance and automatic reports.
Can operators use it on the floor?
Yes. The stop-registration screen is built for a phone or a wall-mounted tablet - large touch targets, one tap to classify a stop, and a live status board for the line.
Does our data stay private?
Your data is yours. Access is enforced with strict server-side controls, and people only ever see the lines and sites they've been granted.
See your real OEE - on your lines.
Book a 30-minute demo and we'll show you live OEE, stop capture and reporting on a line like yours.